Download "Executive Summary/Overview" Chapter
Reliable supply chains that cost-effectively deliver high-quality feedstocks are an important aspect of building a billion-ton bioeconomy. BT16 features scenario analyses of the logistics and transport costs of select feedstocks from chapters 3, 4, and 5 delivered to a commercial biorefinery. A near-term scenario considers the potential of existing commercially available equipment to collect, store, grind, and transport biomass to a single-feedstock biorefinery. The longer-term scenario evolves to a depot-based system where raw biomass is converted to a commodity and allowed to blend with other feedstocks. The long-term scenario also considers the impacts of a high-yield scenario (3% increase per year for most crops) in addition to the base-case yield increase of 1% per year.
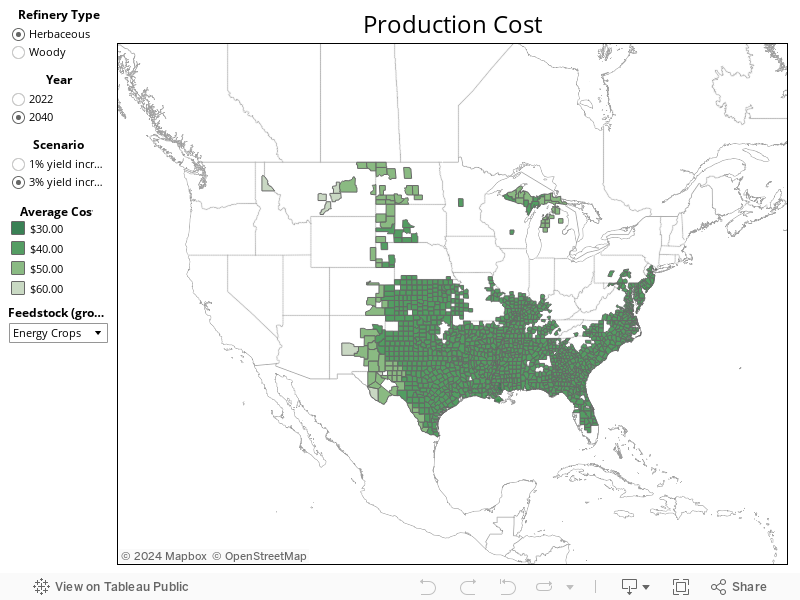
County-level map of weighted average cost of feedstock selected by feedstock case design, feedstock type, supply scenario and year of analysis at the farmgate/roadside.
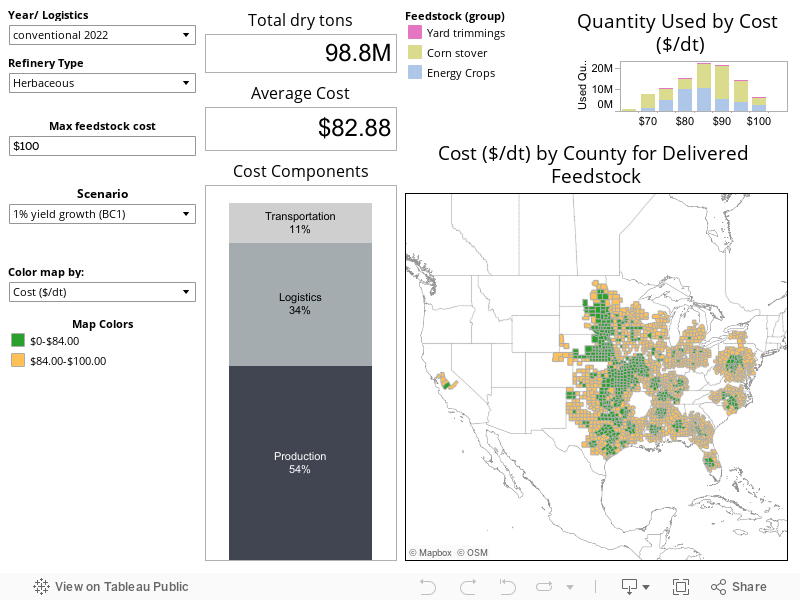
National map of weighted average cost of delivered supply by year of analysis, delivered feedstock case design, maximum delivered price of interest, and supply scenario. Counties in green represent weighted average price of delivered supply less than $84 per dry ton, in orange represent weighted average supply between $84 and 100 per dry ton, and in red represent weighted average cost of biomass supply exceeding $100 to a maximum of $150 per dry ton. Total usable delivered supply based upon choices is represented in the upper left hand of the visualization (delivered is delivered and processed to the biorefinery throat).
Sankey diagram of total biomass estimated at $60 per dry ton or less on the left hand, delivered feedstock case design in the intermediate node, and, on the right hand side, usable supplies at <= $84 per dry ton, between $84 and 100 per dry ton, and unused supply. Select near or two long term supply scenarios. Unused supply represents feedstock unavailable at <= $100 or losses due to handling or storage. Hover over provide feedstock distribution from flows left to right. *Unused resources are those that are delivered at greater than $100 per ton, lost along the supply chain, or part of the overcontracting buffer included in the near-term systems to mitigate supply risk.
Base-Case Yield Scenario 2022
Base-Case Yield Scenario 2040