Download "Biomass Consumed in the Current Bioeconomy" Chapter
Chapter 2 reviews and expands upon the large variety of biomass-based resources identified in the 2005 Billion-Ton Study and 2011 Billion-Ton Update that are currently used for fuels, heat, and power production. This chapter includes greater detail for biopower and secondary feedstocks contributing to energy generation in the industrial sector. Additional detail is included from publicly available bioenergy feedstock production and energy use statistics, particularly for emerging consumption classes.
Table 2.7: Total Current Consumption of Biomass (2014) for Energy and Energy Products (million bioenergy equivalent dry tons per year).
| Biomass resource category | Fuel | Heat and power | Biobased chemicals | Wood pellets | Total utilized biomass | Supply chain losses | Total biomass |
|---|---|---|---|---|---|---|---|
| Agricultural | 127.18 | 10.50 | 5.94 | -- | 143.30 | 13.91 | 157.21 |
| Corn graina | 119.55 | -- | 5.62 | -- | 143.30 | 13.91 | 139.08 |
| Vegetable oils | 5.51 | -- | 0.32 | -- | 5.83 | -- | 5.83 |
| Other fats, oils, and greases | 1.89 | -- | -- | -- | 1.89 | -- | 1.89 |
| Feed for gasoline blendstock/naphtha b | 0.22 | -- | -- | -- | -- | 0.22 | 0.22 |
| Agricultural residues | 0.01 | -- | -- | -- | 0.01 | -- | 0.01 |
| Manure | -- | 10.50 | -- | -- | 10.50 | -- | 10.50 |
| Forestry/wood | -- | 146.16 | -- | 7.61 | 153.76 | 17.08 | 170.85 |
| Wood/wood waste | -- | 146.16 | -- | -- | 146.16 | 16.24 | 162.40 |
| Wood pellets | -- | -- | -- | 7.61 | 7.61 | 0.85 | 8.45 |
| Energy crops | -- | -- | -- | -- | -- | -- | -- |
| Herbaceous energy crops | -- | -- | -- | -- | -- | -- | -- |
| Woody energy crops | -- | -- | -- | -- | -- | -- | -- |
| MSW/other wastes | 30.35 | -- | -- | -- | 30.35 | -- | 30.35 |
| Biogenic portion of MSW | -- | 18.87 | -- | -- | 18.87 | -- | 18.87 |
| Other waste biomass | -- | 11.48 | -- | -- | 11.48 | -- | 11.48 |
| Landfill gasc (bcf) | 9.14 | 272.80 | -- | -- | 281.94 | -- | 281.94 |
| Algae | -- | -- | -- | -- | -- | -- | -- |
| Total Biomass | 127.18 | 187.00 | 5.94 | 7.61 | 327.73 | 30.99 | 358.73 |
Figure 2.4: Spatial distribution of facilities that consume biomass represented by points corresponding to reported nameplate capacity in biomass equivalent tons per year.
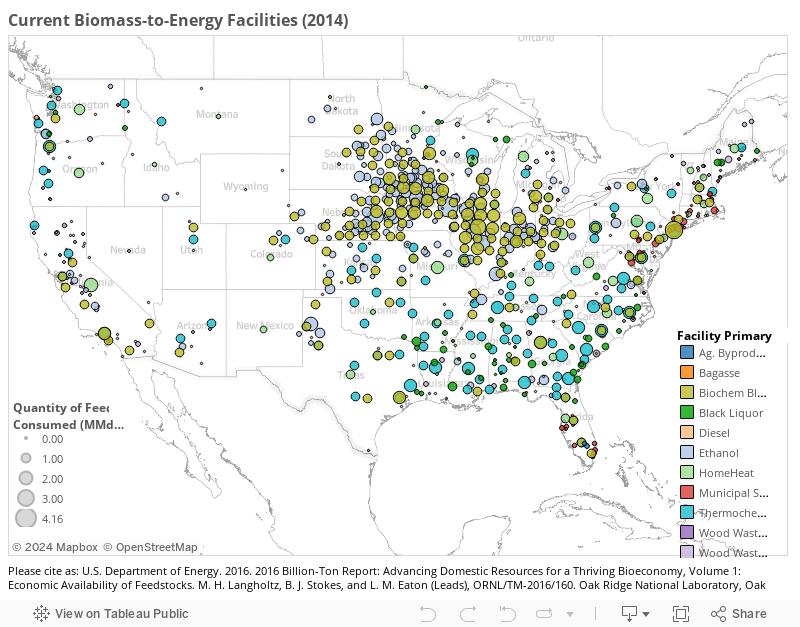
Figure 2.5: Sankey diagram of feedstock type, sector consumption, and final product distribution of currently used biomass for energy and energy products. The hover-over text represents the portion of feedstock represented in final sector consumption.